The Tongue Map Drawn From a Graph With No Numbers on It
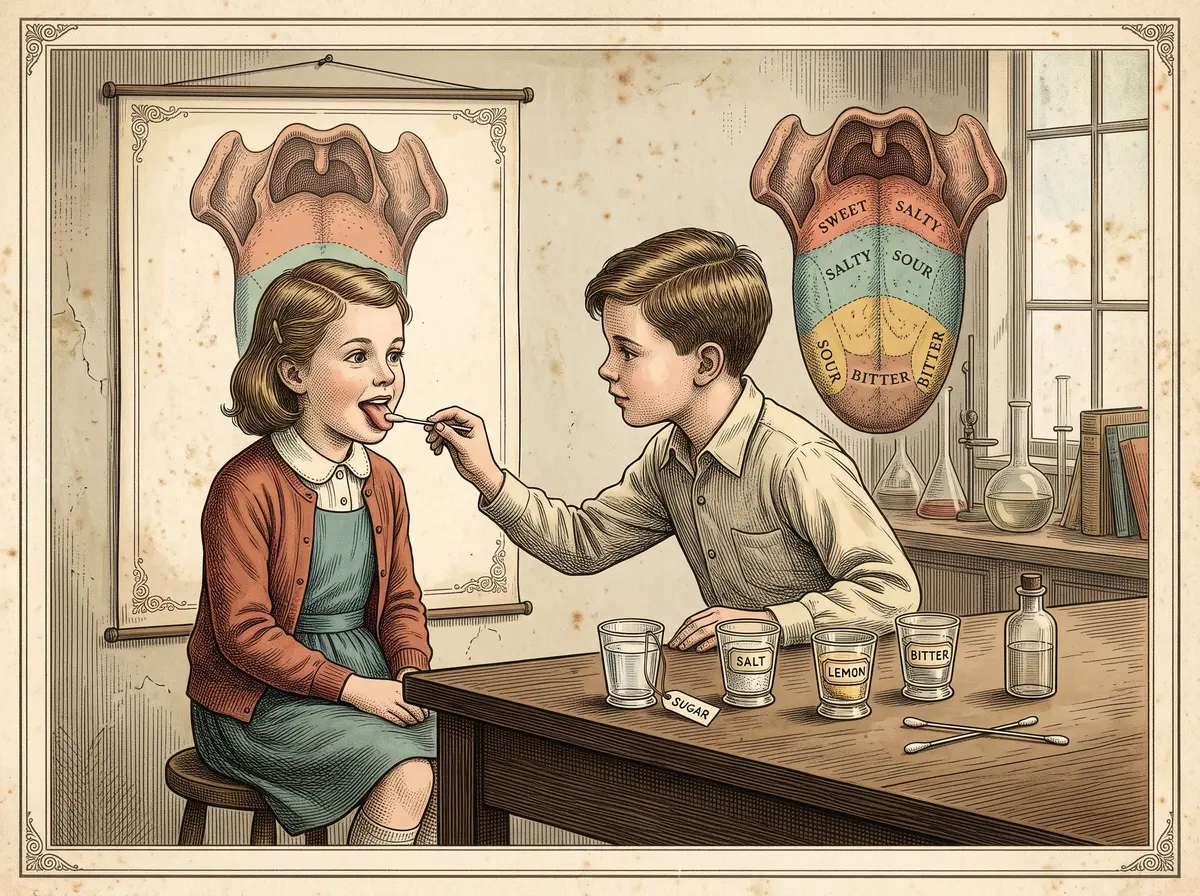
In 1901 David Hänig tested taste in Leipzig. For decades afterward, biology students paired up, stuck out their tongues, and dabbed each other with cotton swabs soaked in sugar water, salt water, lemon juice, and something bitter. The worksheet showed a tidy map: sweet at the tip, salty and sour along the sides, bitter at the back. Then the sugar landed on the "bitter zone" and tasted sweet anyway. Plenty of students decided they must have done the experiment wrong. They hadn't. The map was wrong, and it had been drawn from a graph with no numbers on its scale.
By the Curiosities Desk · · 5 min read · Filed under Biology · Today’s round
Part of The Version Everyone Remembers
What happened: The Tongue Map
The story starts in 1901 in Leipzig, Germany, in the laboratory of Wilhelm Wundt, one of the founders of experimental psychology. A researcher there named David P. Hänig wanted to know whether the four basic tastes recognized at the time (sweet, salty, sour, and bitter) were detected by different mechanisms. His reasoning was simple: if each taste were picked up by its own kind of receptor, the tongue might be more sensitive to some tastes in some places than in others.
So Hänig did the patient work. He picked points around the edge of the tongue, where taste buds are concentrated, and dripped on solutions of sugar, salt, acid, and bitter quinine at different strengths. At each spot he looked for the threshold, the weakest concentration at which a taste could just barely be noticed. He published the results that year in the journal Philosophische Studien under the title “Zur Psychophysik des Geschmackssinnes” (“On the Psychophysics of the Sense of Taste”).
What he found was real but modest. Sensitivity varied a little from place to place. The tip was slightly better at picking up faint sweetness, and the back was slightly better at faint bitterness. The middle of the tongue, which has few taste buds, was less sensitive overall. Hänig showed these patterns as curves on a diagram. Its vertical axis showed sensitivity, but it had no numbered scale. It showed the shape of each taste’s ups and downs, not how big those ups and downs actually were.
Then, for about four decades, very little happened.
In 1942 the Harvard psychologist Edwin G. Boring published Sensation and Perception in the History of Experimental Psychology, a big, respected survey of the field. He included Hänig’s study and redrew the data, this time expressing each taste’s sensitivity as a percentage of its own maximum. Read carelessly, the new curves seemed to say much more than Hänig had found. The low points looked like zero, as if the tongue tasted nothing there. The high points seemed to mark each taste’s private territory.
Somewhere along the way, someone turned those curves into a picture: a tongue divided into neat colored zones, one taste per region. Who drew the first version is hard to pin down, but the image was easy to copy and easy to remember. It moved into textbooks and onto classroom walls, and it became a standard lab exercise.
Why it was strange: The Tongue Map
The map was a picture of an experiment that had found the opposite of what the picture said. Hänig’s subjects could taste every one of the four tastes at every spot he tested. All he had shown was that the faintest detectable dose changed a little from one spot to another.
The difference is like that between “this room is a bit quieter near the window” and “you can’t hear anything near the window.” The first is roughly what Hänig measured. The second is what the tongue map claimed.
What makes the myth especially odd is that anyone could test it in seconds with a grain of sugar. Many students did, in the very lab exercises meant to confirm the map. When their tongues disagreed with the textbook, the textbook usually won. That kept the myth going for generations. Plenty of famous myths survive this way, like The Myth That You Only Use 10% of Your Brain, and this one belongs on the shelf of The Version Everyone Remembers.
What scientists learned: The Tongue Map
In 1974 Virginia Collings went back and tested the question carefully, publishing her results in Perception & Psychophysics. She measured thresholds at different spots on the tongue and the soft palate (the soft back part of the roof of the mouth). She also tested something closer to everyday eating: how well people could tell apart stronger, clearly noticeable concentrations. She found that every taste could be detected wherever there were taste receptors. Thresholds did shift a little from place to place, but not in a way that mattered much. Bitterness was actually easier to pick up on the soft palate than on the tongue.
Later work on the molecules of taste explained why. A taste bud holds dozens of receptor cells, and different cells carry receptor proteins tuned to different tastes. Sweet things trigger one receptor, a pair of proteins called T1R2 and T1R3. Bitter compounds trigger a family of about 25 receptors called T2Rs. Umami, the savory taste of broth and parmesan that is now counted as a fifth basic taste, uses yet another pair. A 2006 review in Nature by Jayaram Chandrashekar, Charles Zuker, and colleagues summarized the picture: each basic taste has its own dedicated cells. But those cells aren’t sorted into neighborhoods. Taste buds all over the mouth contain cells for every taste.
So Hänig’s original instinct was partly right: different tastes do use different receptors. He just couldn’t see them, and the map took his small threshold differences far beyond what his data showed.
How it reaches us today: The Tongue Map
The tongue map is still being un-taught. The Association for Chemoreception Sciences, a society of taste and smell researchers, publishes a classroom activity built to show students that the old map is wrong: dab a cotton swab of sugar, salt, lemon juice, bouillon, or coffee on the tip of your tongue and name the taste.
The story is also a handy warning about graphs. A chart with no numbered scale can make a small difference look like a total one, and a redrawn chart can say something the original never did. Researchers and science journalists still point to the tongue map as a case study in checking the axis before believing the picture. For another taste story that spread far beyond its evidence, see The MSG Panic a Surgeon Confessed to Starting on a $10 Bet.
Fun fact: The Tongue Map
Your tongue isn’t the only place you can taste. Taste buds also sit on the soft palate, in the throat, and on the epiglottis, the flap that covers your windpipe when you swallow.
Sources: The Tongue Map
- David P. Hänig, “Zur Psychophysik des Geschmackssinnes,” Philosophische Studien 17 (1901): 576–623, via the Max Planck Institute for the History of Science Virtual Laboratory: http://vlp.mpiwg-berlin.mpg.de/library/data/lit4562
- Virginia B. Collings, “Human taste response as a function of locus of stimulation on the tongue and soft palate,” Perception & Psychophysics 16 (1974): 169–174: https://doi.org/10.3758/BF03203270
- Jayaram Chandrashekar, Mark A. Hoon, Nicholas J. P. Ryba, and Charles S. Zuker, “The receptors and cells for mammalian taste,” Nature 444 (2006): 288–294: https://pubmed.ncbi.nlm.nih.gov/17108952/
- Steven D. Munger, “That Neat and Tidy Map of Tastes on the Tongue You Learned in School Is All Wrong,” Smithsonian Magazine (2017): https://www.smithsonianmag.com/science-nature/neat-and-tidy-map-tastes-tongue-you-learned-school-all-wrong-180963407/
- “Scientific Urban Legend—The Bogus Tongue Map,” Essay 15.1, companion site for Sensation and Perception, 4th ed. (Sinauer Associates / Oxford University Press, 2015): https://learninglink.oup.com/public/files/cdn/wolfe4e/essay15.01.html